Report Display
Header
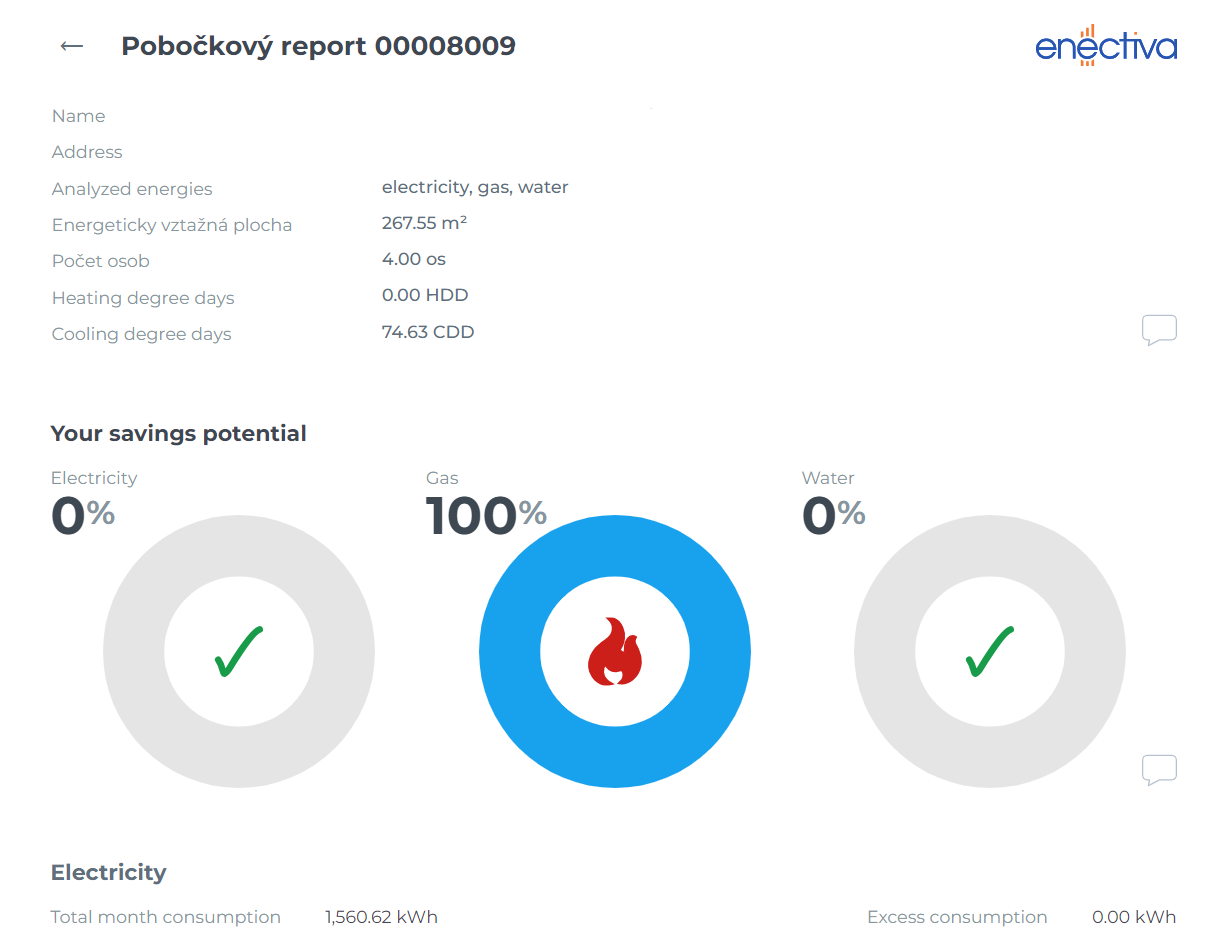
Here you can see basic information about the entity to which this report relates and a brief summary of the potential for savings.
The area is represented as an energy reference area. Persons represent the number of inhabitants. Dayrates (heat) represent the sum of heating dayrates for the whole month. Similarly, dayrates (cold) represent the sum of cold dayrates for the whole month.
The first bar charts you see show your potential for savings. In the example below, you can see that the first energy - electricity - has a green pipe in its centre, which means that the potential for savings is 0%. This means that the actual consumption is less than or equal to the theoretical consumption.
The second energy, gas, has a total potential for savings of 100%. This means that in December you could save 100% of your gas costs if you used as much as the theoretical consumption suggests.
The third energy (water), like electricity, has a green pipe in its centre.
If you need to print the report to PDF, you can use CMD+P or Windows+P. If the client wishes to add a logo to the report, SVG format logos are supported.
Clients are not yet able to create their own reports.
Individual charts
In the graph representing the specific energy consumption you can see the black line - this line shows the theoretical consumption - everything beyond this line (the red part of the bar) shows the potential savings (i.e. it is the real consumption above the theoretical limit).
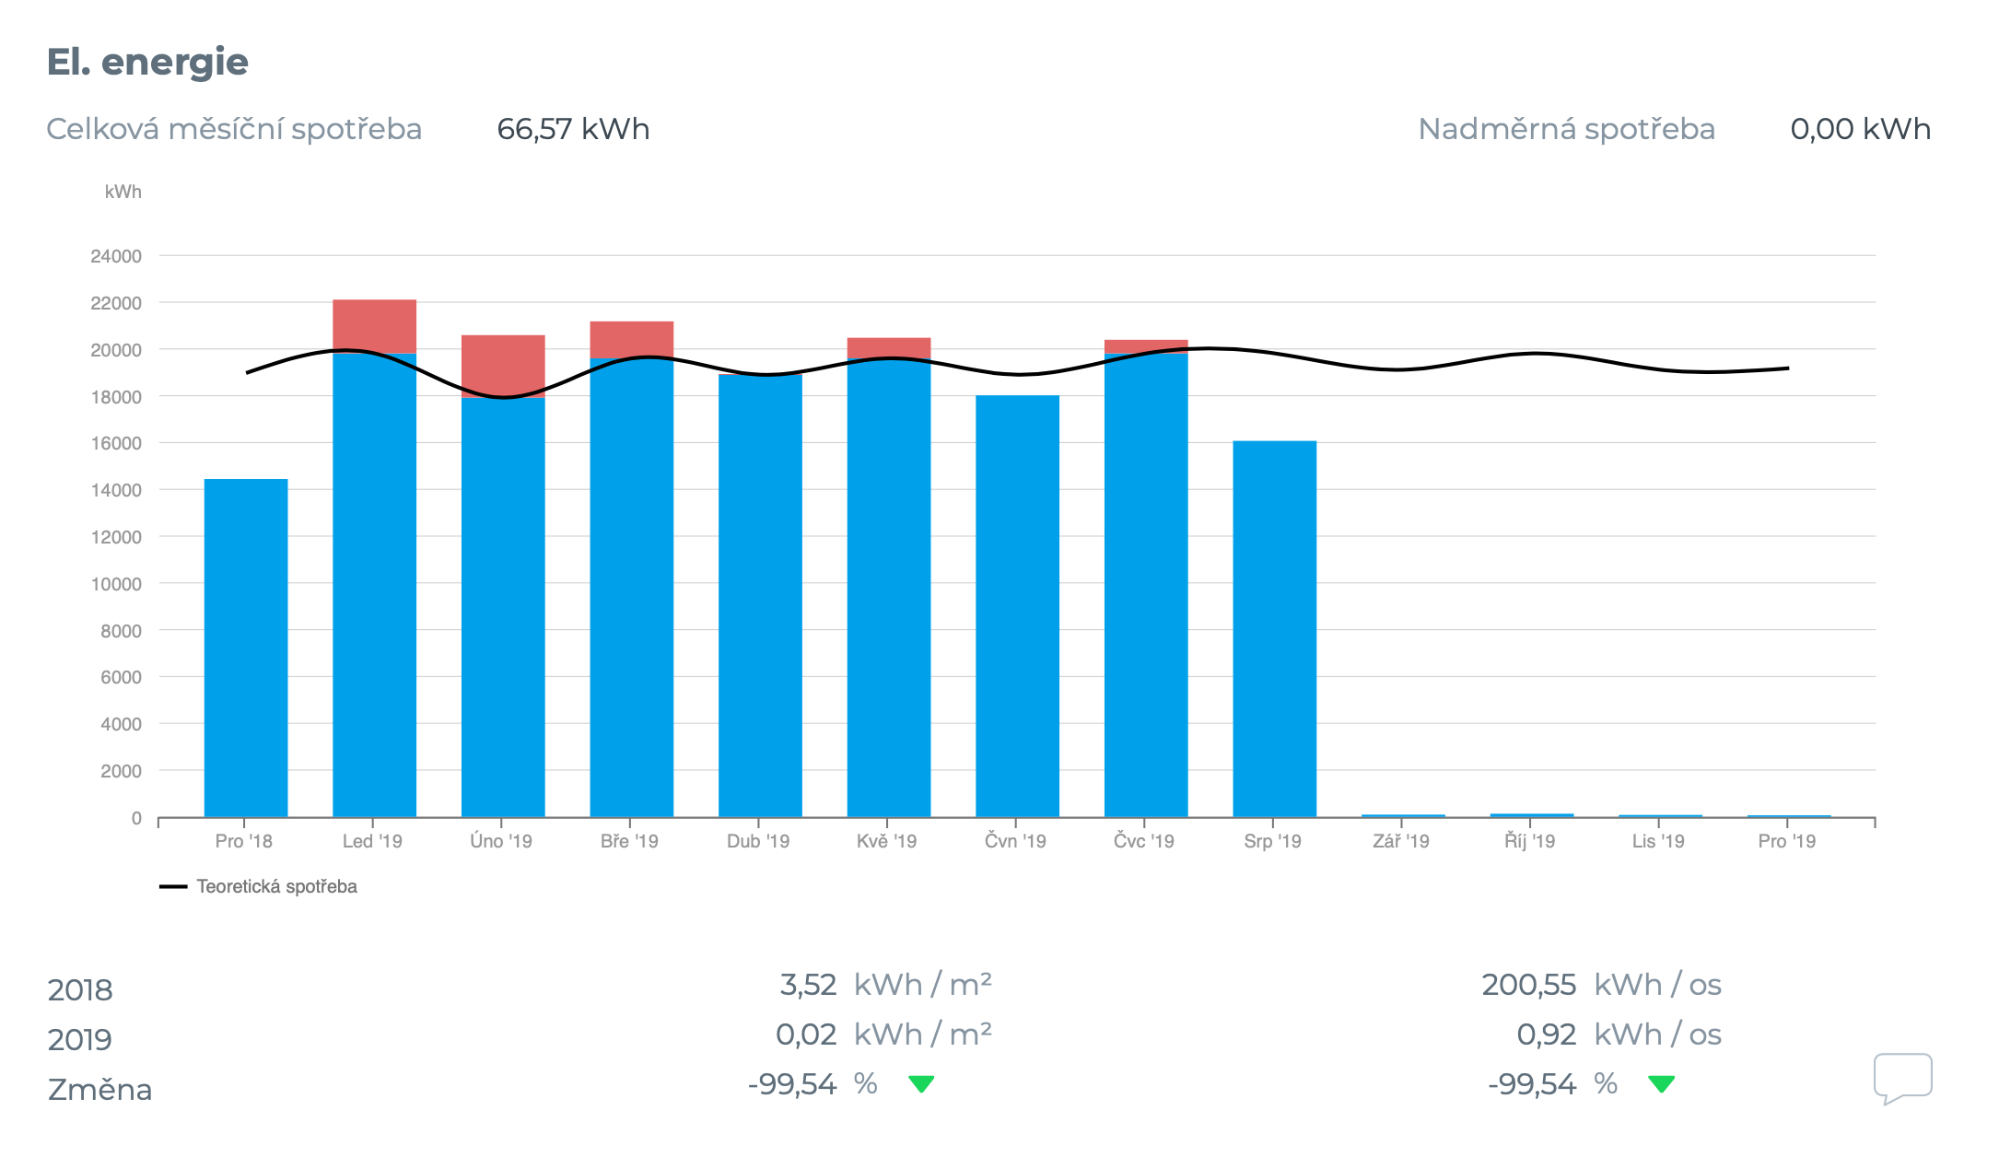
Below the chart is a table that shows the consumption divided by specific parameters. The first two rows show the data for the last two years. The third row shows the change (a positive number with a red arrow symbolises increased consumption). For graphs showing heat (cooling) consumption, the second column is divided by the total number of day-steps (cooling) and the third is divided by the energy reference area. For graphs showing electricity and water consumption, the consumption is divided by the number of persons instead of the number of day-days.
Comments and tags
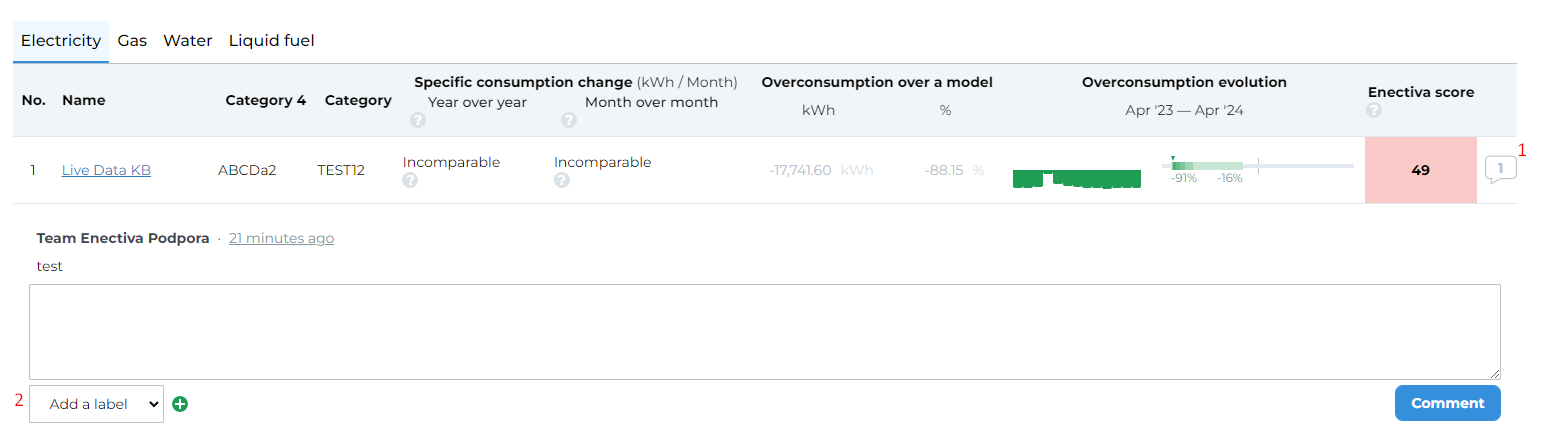
You can post comments to the reports in the dedicated box by pressing the "View Discussion" button on the reports page. You can edit or delete your comments, but you cannot interfere with the comments of others.
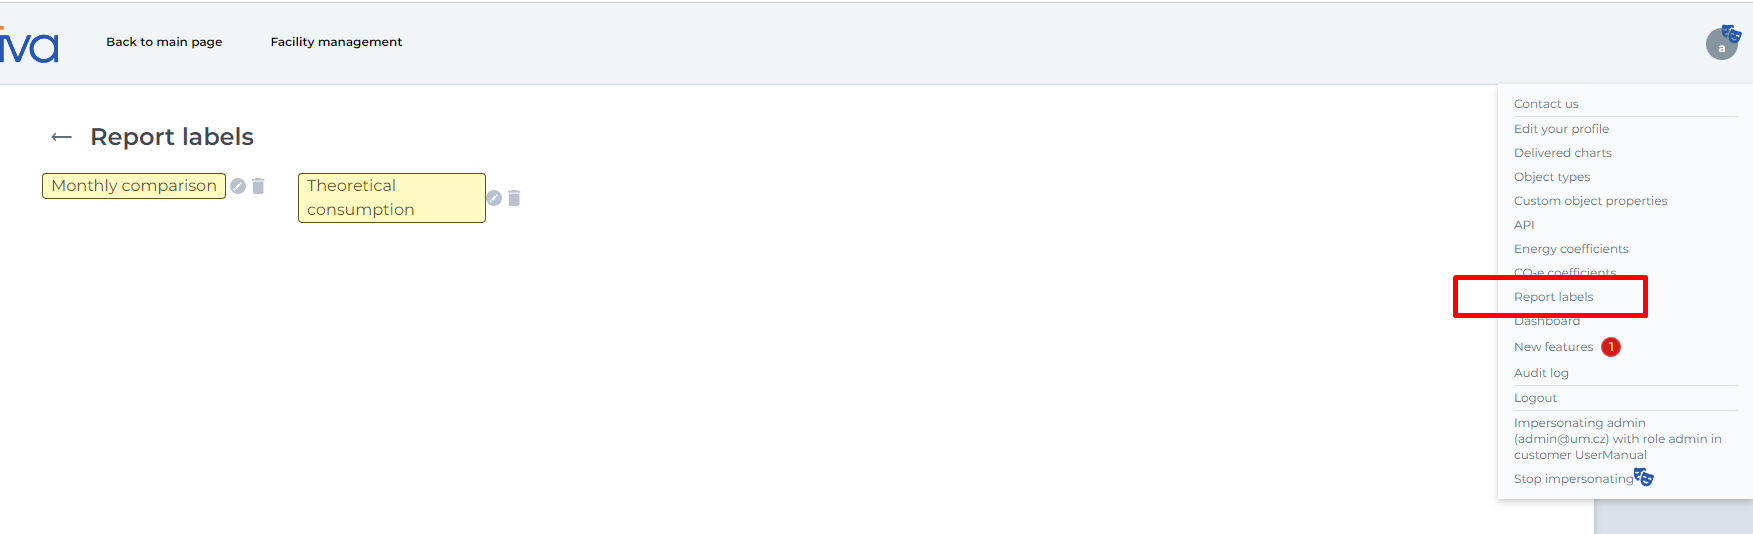
In the comments section, you can distinguish various topics using tags. The list of tags for reports can be viewed by clicking on your account in the upper right corner and then opening "Report Tags." Here, you can create, edit, or delete tags. Once you open "Report Tags," you will see all your saved tags. You must create a tag first before it can be assigned to a comment.
- Click on the comment icon to write a comment.
- To add a tag to your comment, use the drop-down list found in the discussion box “Add a label”