Dashboard
Dashboard is a new feature of Enectiva where the user can easily create a customized overview of several charts on one page. The graphs on the page are scrollable and can be displayed three side by side.
Using the Dashboard feature
Initially, the Dashboard is not enabled, and several steps are required to set it up. First, select the graphs from the Statistics tab that you want to display on the new Dashboard. The procedure for displaying a graph on the Dashboard is described in the section "Creating an Automatically Sent Graph".
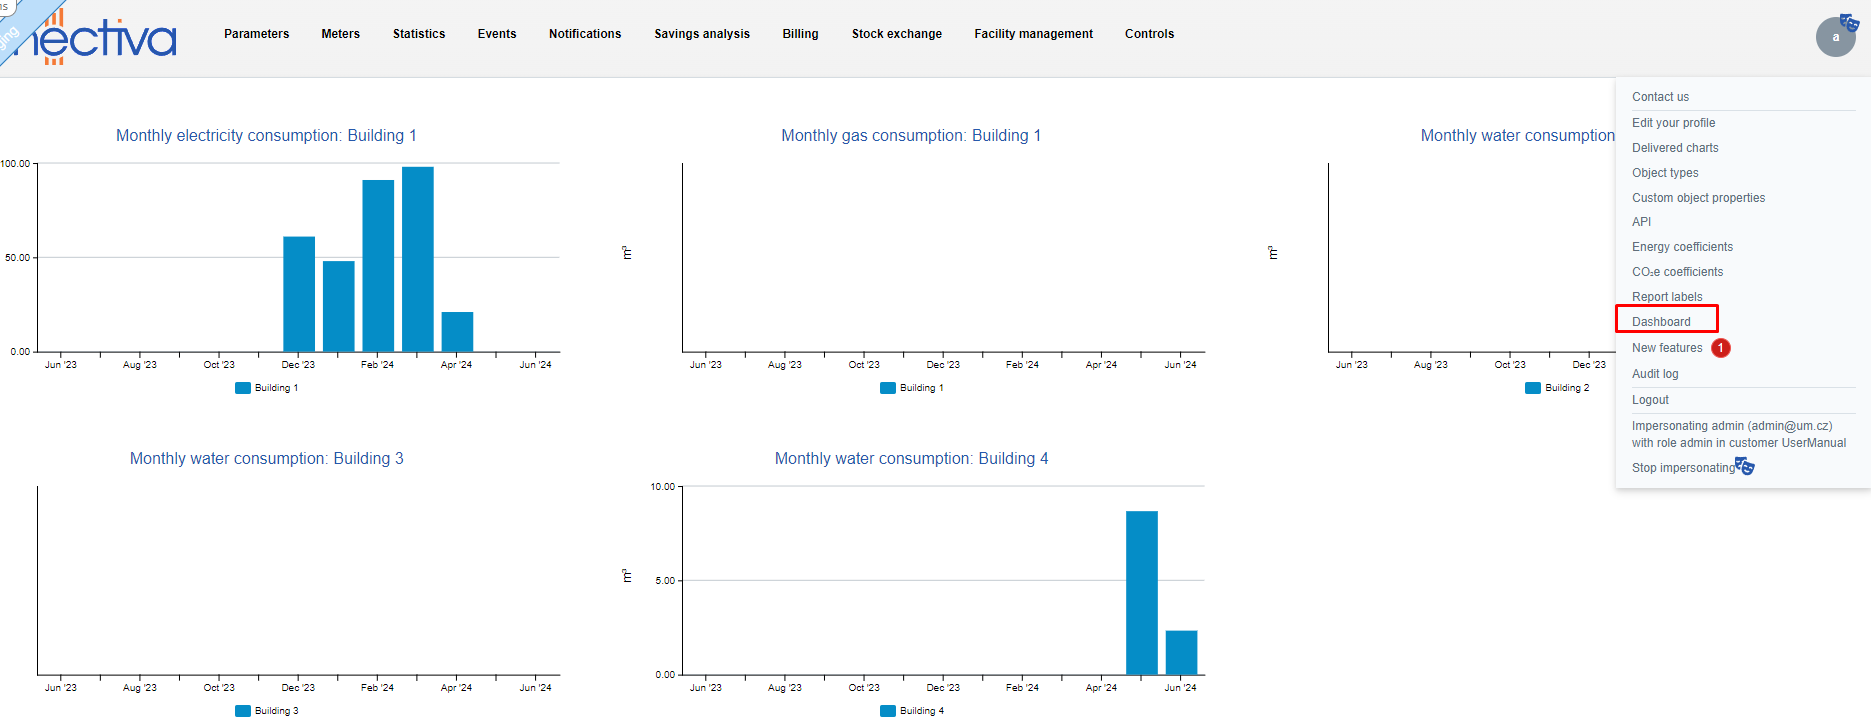
Once the graph is saved, it will be automatically uploaded to your new Dashboard. It can be accessed via the menu button in the upper right corner after clicking on the user profile, and also immediately after logging into the application. When you click on the Dashboard button, the Dashboard will appear.
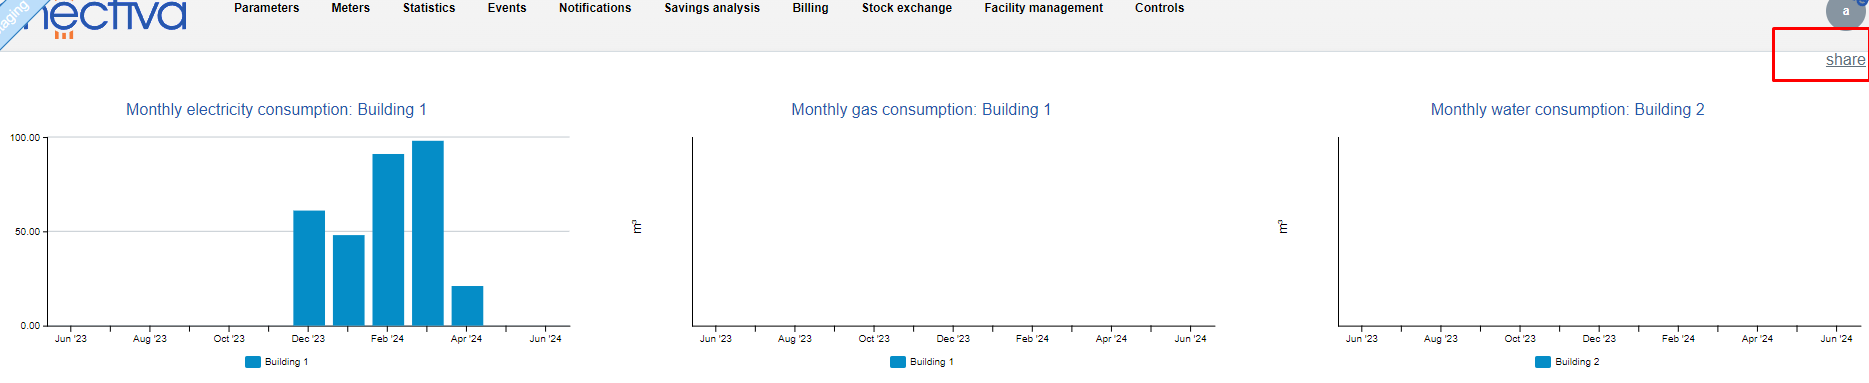
Sharing function
The dashboard also offers a sharing option, where the person with the link only sees the dashboard page itself, so that they cannot interfere with the Enectiva application in any way. To share, simply click on the "share" button, which then generates a link that can be copied to the clipboard and sent to wherever and whomever it is needed.