Set charts
Enectiva allows you to automatically send charts or statistics to your email. You can also publish the selected chart - enectiva will generate a link and you can send it to anyone you want - even people who don't have access to enectiva.
Inbox charts are sent with selected frequency at 11am.
Creating an automatically sent chart
First, from the Statistics section, view the chart you want to send and click View on the right side.
Keep in mind that each selected time period will move forward one day with each email sent. For example, if you want to receive a consumption graph from the previous day, select the time period of the displayed graph to "today". What will be sent to you tomorrow will be the graph from today. Therefore, the day after tomorrow you will receive tomorrow's chart.
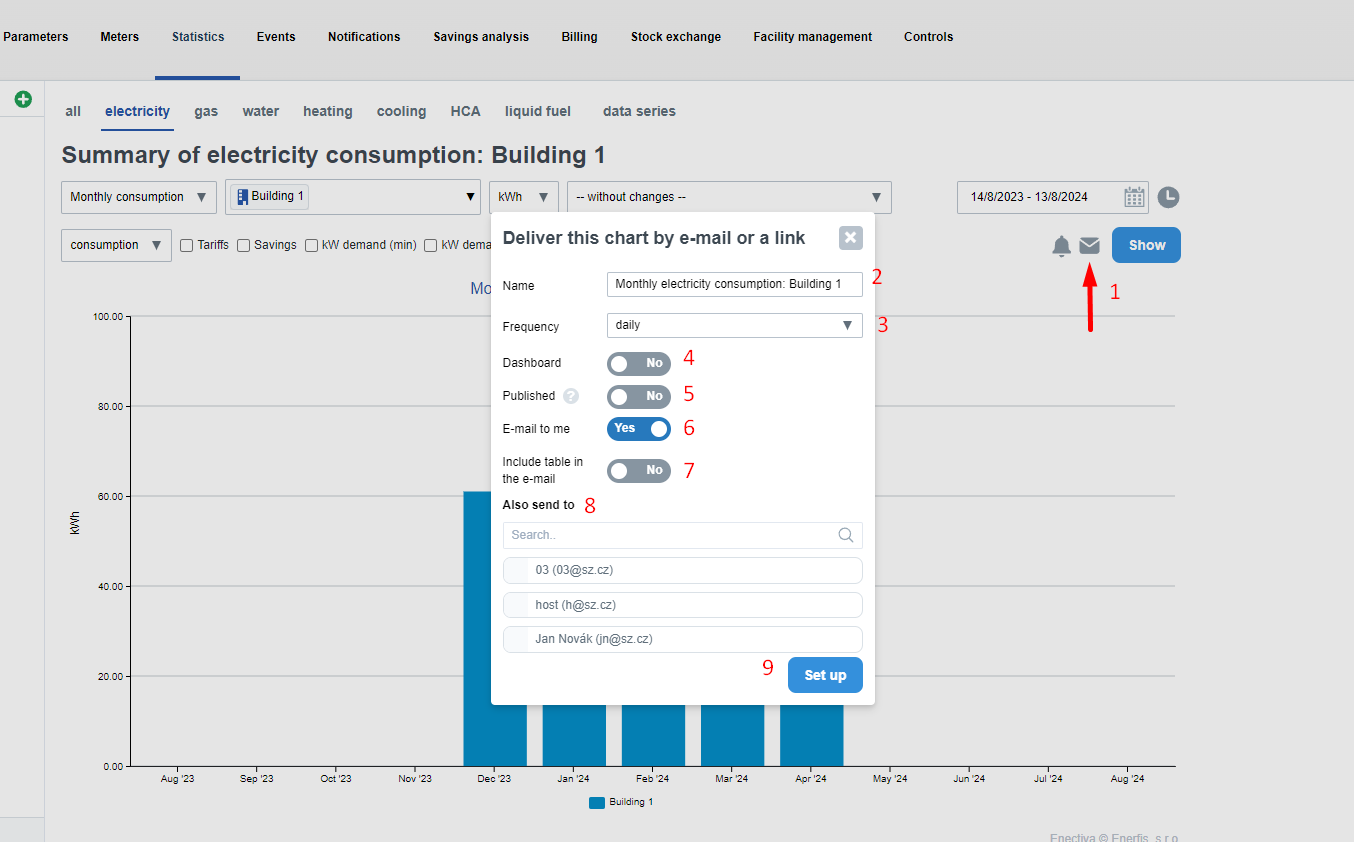
- You can set up the sending of the chart by clicking on the icon below.
A dialog box will open. Its parameters have the following meaning: - The name is filled in automatically and can be changed
- Frequency determines how often the chart should be sent
- Check the "Dashboard" box if you want the graph to be displayed on the homepage after logging into the application.
- Check the Published box if you want to send someone a direct link to this chart
- Check the "Send to my email" box - if you want to receive the chart by email.
- Table in the email - this option is visible only if the chart is set to be sent via email. When this option is activated, the user will receive an email with an attachment containing the same table that the user would see in the statistics section when downloading the data manually.
- Send also to - here you can select additional users who will receive the chart.
- You can finish and save the chart sending settings by pressing the "Set up" button. If you checked "Published," a link to the chart image will be displayed.
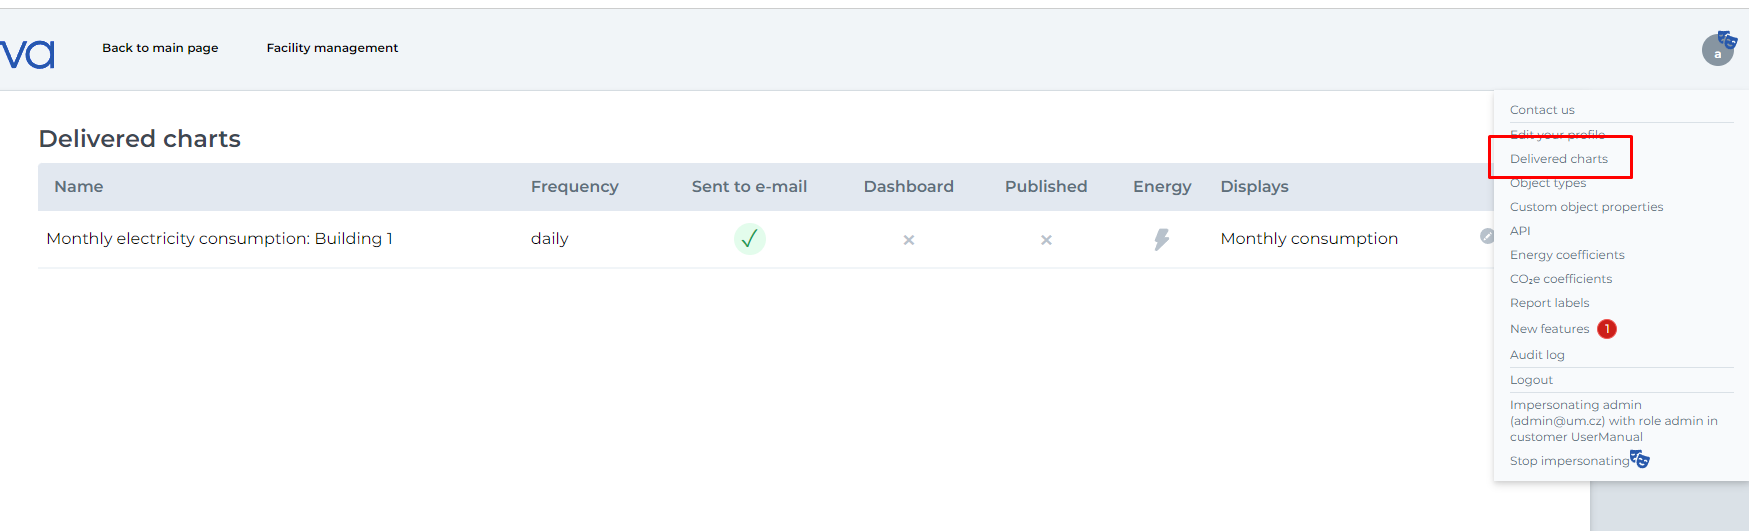
List of sent charts
To view, edit or delete charts you have already created, click on the icon of your name in the top right corner and select Set Charts.