Savings analysis
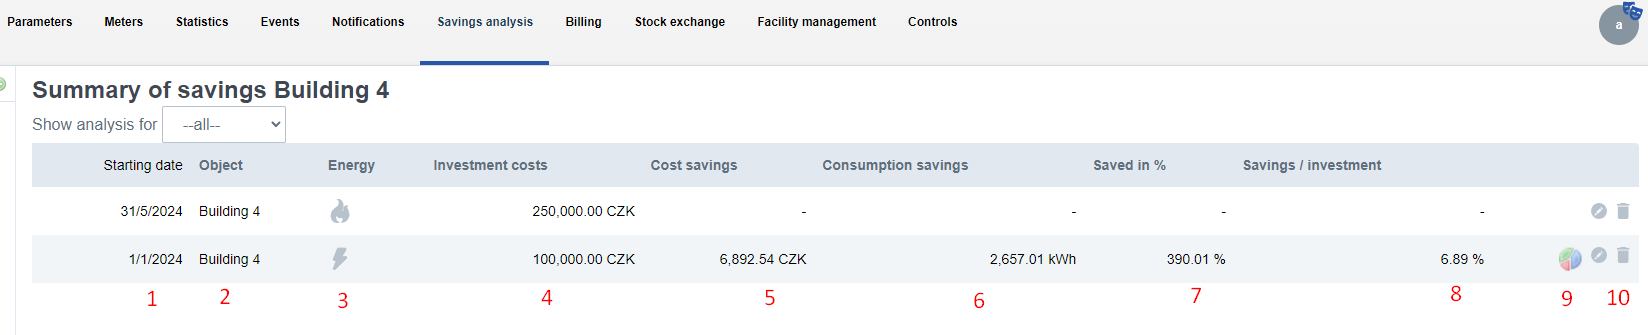
In this section, you can track energy savings over a period of time. Each savings analysis must be started with an event. Under the Savings Analysis tab, you can see a list of events that should have an impact on energy savings.
-
The first column shows the date from which the savings are calculated. This date is set if a savings monitor is associated.
-
Entity under which the savings analysis falls (building, tenant, etc.)
-
The type of energy that the savings analysis analyses
-
Initial one-off costs associated with investing in energy efficient technologies. They are also used to calculate the net present value of the project in the financial analysis. See Savings analysis.
-
The value of savings in CZK from the beginning of the reporting period to the present. This value is calculated by comparing the consumption in each month with the reference value of the corresponding month or its proportional part (e.g. If it is the 15th of the month and the project has not yet ended, the reference value for the current month is 100 CZK and the cost for this month is 40 CZK, the calculated savings are 10 CZK = 50 - 40, not 100 - 40).
-
Displays the amount of energy saved in kWh (see point 5)
-
Shows the average daily savings relative to the reference period.
-
Savings divided by the initial investment, the result is shown as a percentage
-
A bar chart showing the user's financial analysis. The icon on the right (white cross on red background) cancels the savings analysis.
-
You can edit or delete the event
Reference value
To analyse the savings, it is necessary to have sufficient data to compare the measured values after the event that affected the savings. At a minimum, annual data ending one month prior to the start of the savings event is required to calculate any savings analysis parameters.
Example: if the savings event occurred between January 1 and January 31, 2014, you must have dates from at least January 1, 2013 to December 31, 2013.
The maximum amount of data that can be counted on is 36 months, i.e. 3 years. Only months are counted.
Example: if the first recorded value is 15 June 2012 and the saving event occurred on 1 January 2014, the dates from 1 July 2012 to 31 December 2013 are used to calculate the comparative data. June 2012 is not used.
For each calendar month, Enectiva calculates the arithmetic average of consumption and costs. These values are further used as reference values.
Financial analysis
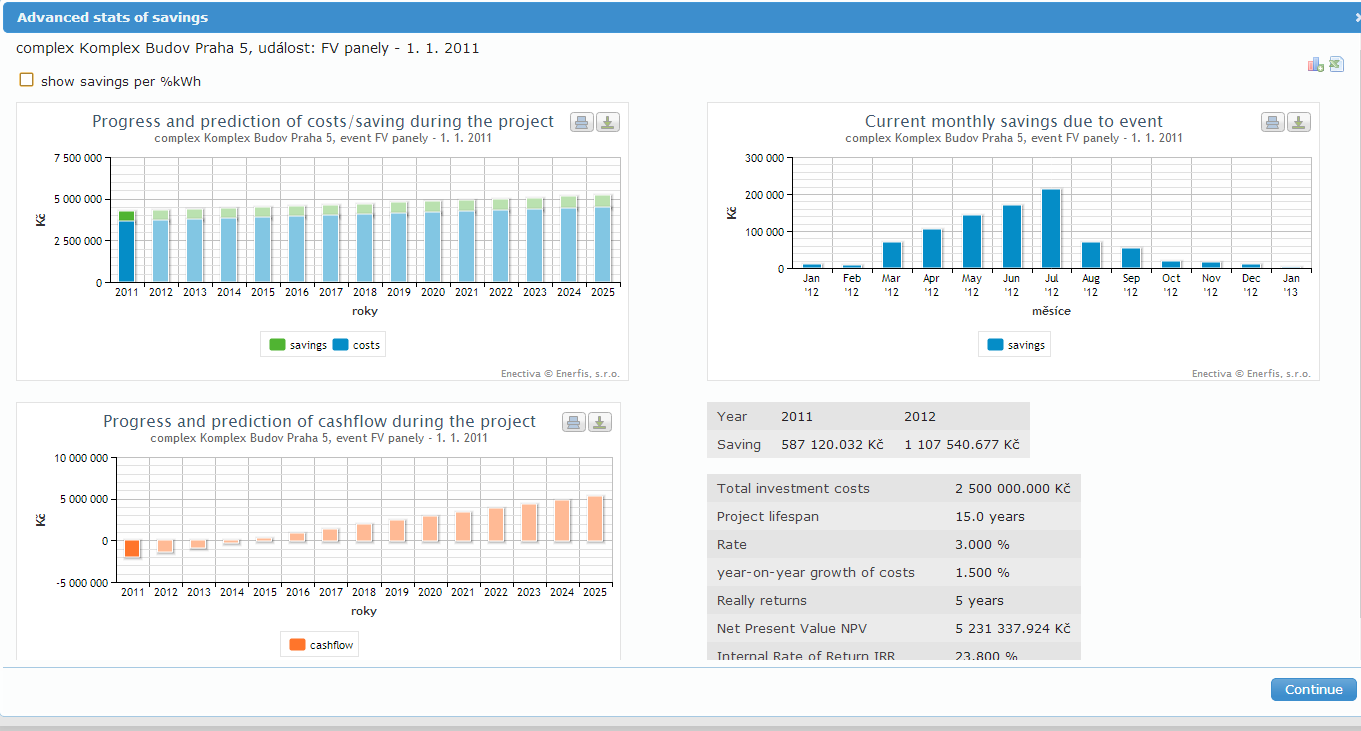
For the example of the replacement of windows for the tenant Novák at the beginning of 2013, it is possible to draw up various analyses related to the planned savings.
-
The first graph shows the projected costs and savings interpolated into the future according to the internal model of Enectiva.
-
The second chart (right) shows the savings achieved in the current year. Consumption is compared to the reference period described in point 5 earlier on this page.
-
This chart shows the expected evolution of the cash flow from the initial investment to the end of the project lifetime. The first item of cash flow is usually always negative; it is the initial investment, which always represents a cash outflow. If the cash flow remains negative until the end of the project life, it is not worth implementing the project because it is not able to pay for itself during its lifetime. Another indicator of the profitability of the project is the Net Present Value (NPV), which is shown in the table in the right-hand corner of the financial analysis and whose value is identical to the value of the cash flow in the last year of the project's life (in our example ( -99 601,44 CZK) See point 4.
-
This table provides basic financial information on this investment project.
- The total investment cost is the initial amount spent on cost-saving measures that preceded the financial analysis.
- The lifetime of a project can be understood as the maximum period of time for which the investor is willing to follow the development of savings. The project life is also used to calculate the NPV and the real return on the project.
- The interest rate and annual energy growth are preset in the event editor (see Create a new event).
- The real return is the number of years it takes, at a given interest rate and energy growth, for the investment to start earning a return to the investor. E.g. if the project duration is 10 years and the payback period is 4 years, it means that from the fourth year onwards the project's profitability will be greater than the value of the original investment. If the project never pays off, the Enectiva will show 0 years.
- The net present value (NPV) is the present value of the project at which future cash flows are discounted at the interest rate. If the NPV is negative, it is not worth implementing a cost-effective project. In other words, the project will never be able to pay for itself. NPV is also used to compare two different investment projects. A higher NPV project is always more profitable for the investor.
- The internal rate of return is in fact the interest rate (discount) at which the NPV is zero.
Note: To calculate and analyse savings, data for at least the previous three years is required. Otherwise, no graph or savings analysis will be displayed.