Events
In this section, you can set events that have a potential impact on the amount of energy consumed and thus on the cost of the corresponding energy. The events are either entered automatically, for example in case of a change in the portfolio structure (new building at complex level, new tenant at building level, etc.), a change in parameters or a change in energy prices.
All these changes can be displayed together in the overall event list. You can also set the expected impact on energy consumption (Energy Impact) for each event. For example, a window replacement is expected to have a significant impact on energy savings, while a change of homeowner is unlikely to have a similarly significant impact on savings.
These events can then be displayed on the timeline in the corresponding graph in the Statistics section. For example, you can see how each event appears on the graph in the following image. At the same time, event analysis can be based on a single event and track the energy consumption that was generated by that event. For detailed information about the savings analysis feature, see the relevant section.
Create a new event
To create a new event, enter the date the event occurred and a description of the event, which will then be displayed in the statistics section of the charts. Next, set the Energy Impact and check the Savings Analysis checkbox to track specific energy type, input cost, and project lifetime. These items are important for the financial analysis available in the Savings Analysis section.
If you check the Savings Analysis checkbox, then check the Use Advanced Economic Indicators checkbox to specify the interest rate and the annual energy price growth rate. The interest rate is the discount rate used to recalculate the net present value (NPV) of the energy savings investment. In other words, it is the potential return that an investor would have earned in an alternative investment if they had not invested in energy savings. The annual energy growth should represent the percentage increase in energy costs each year until the end of the life of the project. If the interest rate and energy growth rate are not specified, the default value is 3% and 0% respectively. Again, the results of the financial analysis and a description of the model used for the analysis are available in the Savings Analysis section. The following figure shows an example of the creation of a new event.
Example: a building has recently been renovated and a heat pump has been installed. In order to track the potential savings on energy consumption on gas consumption, we create a new event. We do this via the Events tab -> Create New Event and then fill out the form.
In the event, fill in the name, date and estimated impact on energy consumption. Then, to track the savings analysis, you must check the Savings Analysis box.
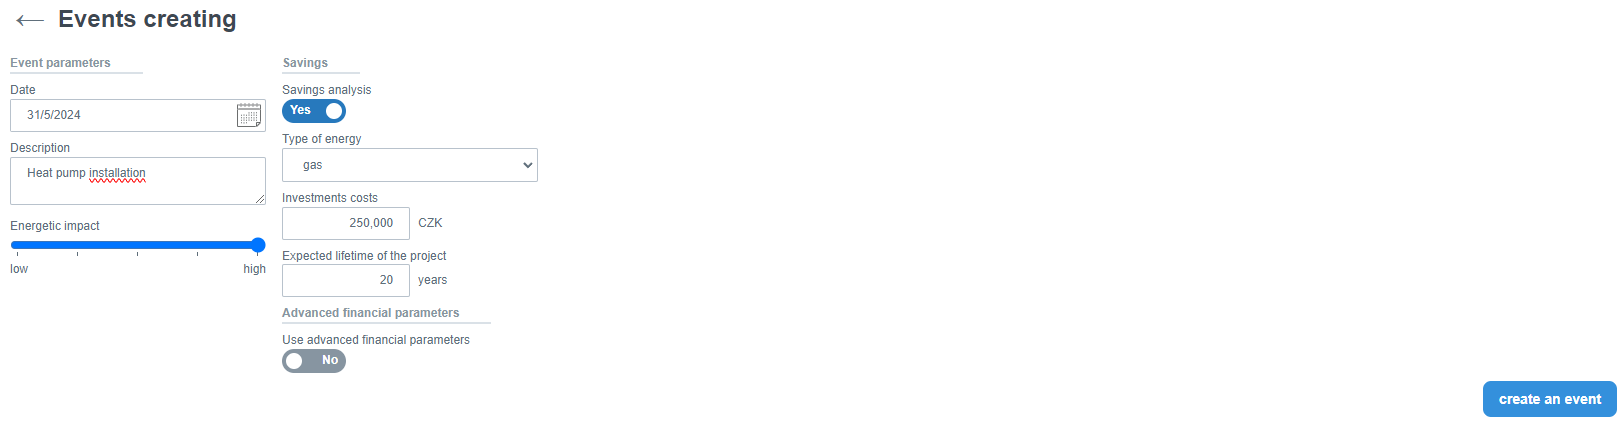
Advanced parameters for savings analysis are then displayed.