Monthly data display policy
The calculation of the consumption data for a month is done as follows: for a given month, the difference between the last day of the month and the last day of the previous month is calculated. To show the energy consumption in May, for example, Enectiva takes the last measurement on 30 April and subtracts it from the last measurement on 31 May. If a reading is not available on April 30th, but only, for example, on April 26th, Enectiva evenly distributes the consumption over the remaining April days to obtain a fictitious reading for the last day of April. If multiple readings are available during the day, only the most recent daily record is considered. See the following example.
Example: the Enectiva processes the readings according to the table below.
| Value [m3] | Date of deduction |
|---|---|
| 90 | 24.1.2019 13:00 |
| 100 | 31.1.2019 13:00 |
| 125 | 15.2.2019 13:00 |
| 150 | 25.2.2019 13:00 |
| 156 | 1.3.2019 13:00 |
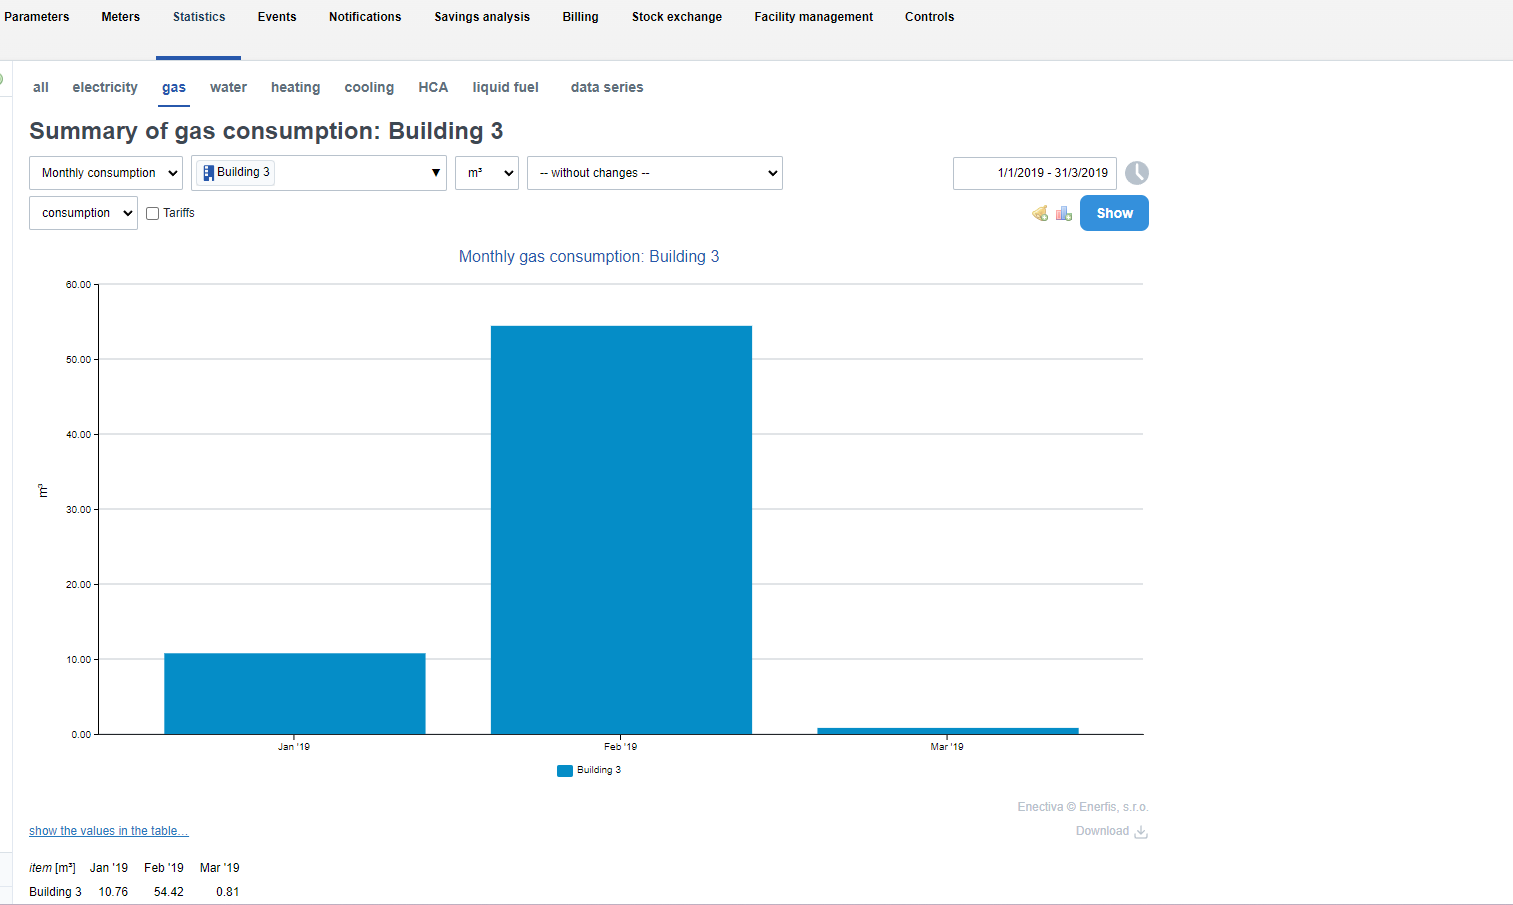
- January: to calculate the consumption in January, the last reading of 30 December is usually subtracted from the reading of 31 January (see above). However, since we only have January data, January consumption is calculated from January data only: 100 m3 from 31 January subtracted from 90 m3 from 24 January, which is equal to 10 m3. You can see that the actual value is 10.76 m3 and this is because the reading was made at 13:00 on 31 January. Therefore, the gap between 13:00 and 24:00 is filled with the consumption calculated from the next reading in February.
- February: to calculate the consumption in February, proceed as follows. We have the reading from 31 January (100 m3), but we are missing the reading from 28 February. However, Enectiva can estimate this value from the available data. The last February reading is on the 25th of February (150 m3), the first March reading is on the 1st of March (156 m3), a difference of 6 days. Enectiva subtracts 150 m3 from 156 m3 and divides the consumption evenly between the days. We assign this to the day of 28 Feb. Consumption of 150 + 5 = 155 m3. Consumption in Feb. is therefore approximately 155 m3 - 150 m3 = 55 m3.
- March: consumption in March can be similarly determined: 156 m3 (last available day of March, i.e. 1 March) subtracted from 155 m3 (data from 28 February). The total consumption in March is therefore approximately 1 m3.
If multiple readings are available during one day, Enectiva always works only with the most recent daily readings. For example, in the example above, if a reading of 153 KWh is entered at 12:00 on March 1, 2019, only the most recent daily reading will be used to interpolate and calculate the monthly consumption, in this case 156 KWh at 13:00.