Dashboard
The dashboard is used to display selected charts and metrics.
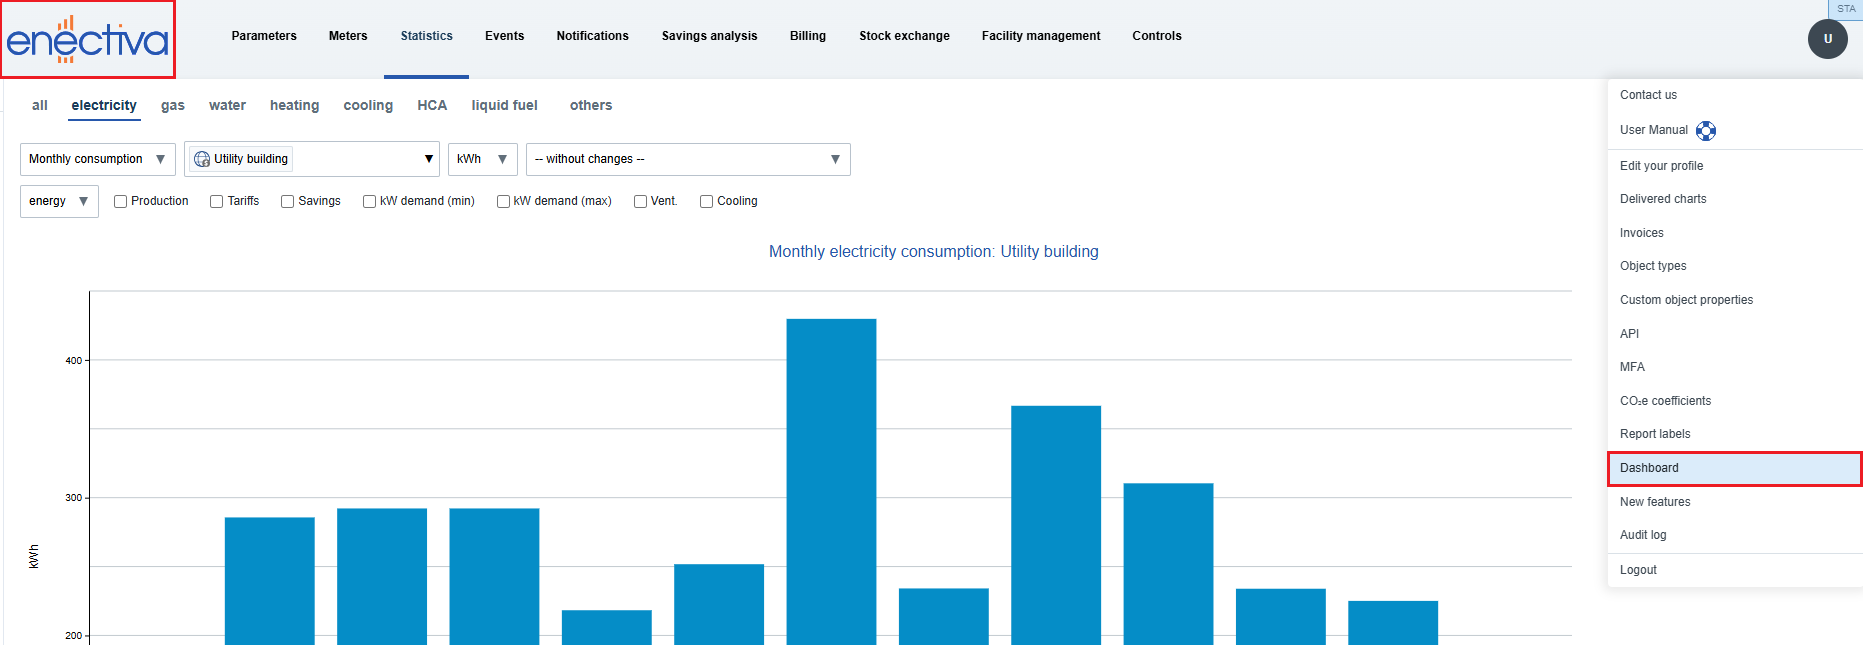
If a dashboard already exists, it is automatically displayed as the landing page after login. If no dashboard has been created yet, you can open it either from the menu under your username by clicking Dashboard, or by clicking the Enectiva logo in the upper-left corner.
After that, an introductory page is displayed with guidance on how to add the chart and create a metric.
Charts on the Dashboard
Adding a Chart
- First, configure a chart in the Statistics section.
- Click the pin icon 📌 next to the envelope icon ✉.
- The chart is automatically added to the dashboard.
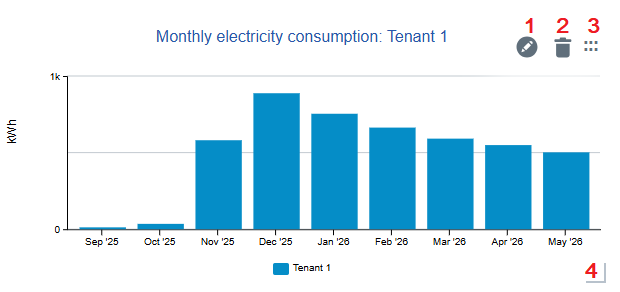
Editing a Chart
- Click the "Edit chart" icon to change the chart name or hide the legend.
- Click the trash icon to remove the chart.
- Use the drag handle icon to move the chart.
- Resize the chart by dragging the lower-right corner. The size can only be adjusted within predefined sizes.
Metrics
Adding a Metric
On the dashboard, click the + button and then click the Metric configurator link. Enter the metric name, choose the metric type, and then configure additional parameters depending on the selected metric type.
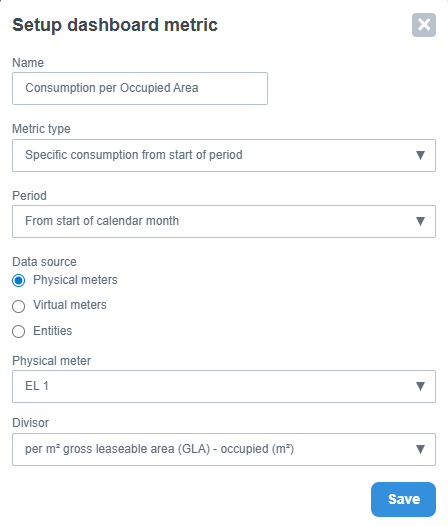
After saving, the metric is displayed as a separate card on the dashboard.
Metric Properties
- If a metric cannot be displayed, the status "Unavailable" is shown. The reason can be viewed by hovering over the question mark icon.
- Metrics, like charts, can be edited, removed, moved, and resized.
⚠️ Moving and resizing charts and metrics is not supported on touch devices.
Sharing the Dashboard
The dashboard can be shared using the Share button in the upper-right corner.
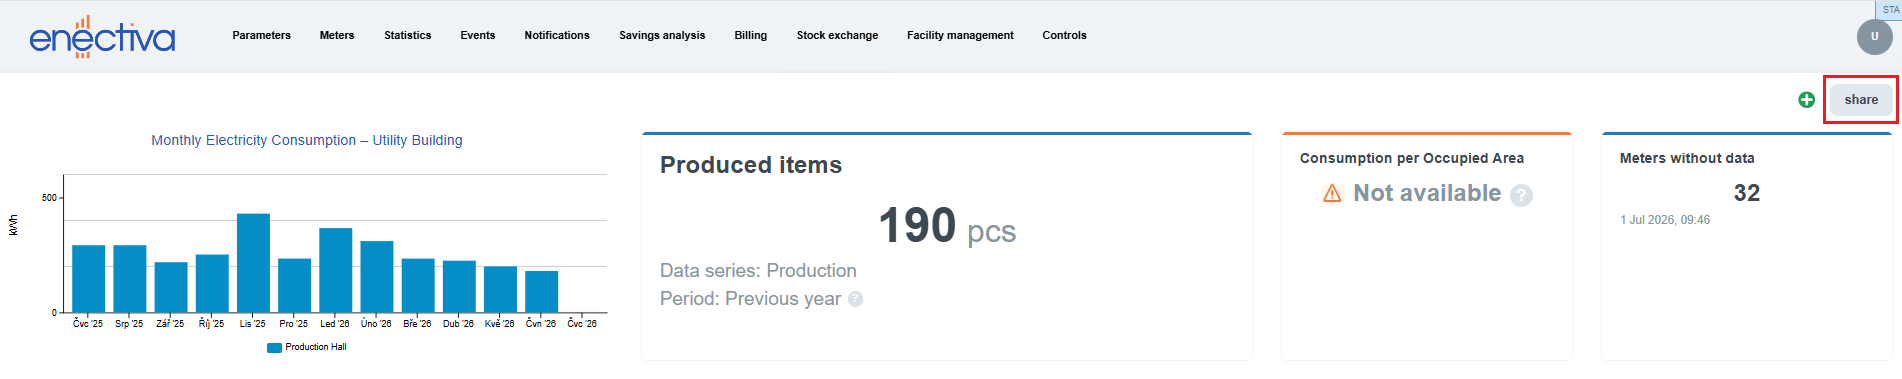
After clicking the button, a link is automatically copied. Opening the link displays only the dashboard without access to the rest of the application.